
We wish all of you, and your families a Happy New Year and many more years of good health!
While businesses reflect on their losses and gains on the year-end, we are super excited to be back in the new year, writing some tips with the hope that we can help everyone elevate their game.
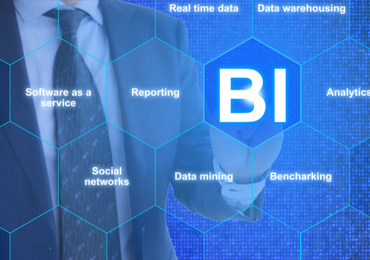
Today we are going to talk about why any business, irrelevant of size, must visualize data consciously. Organizations around the world have started to develop an unquenchable thirst for insights.
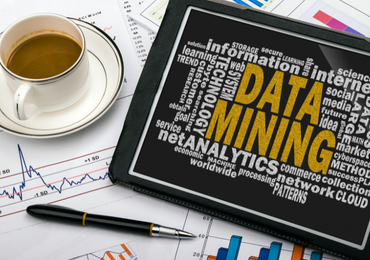
Because of the way the human brain processes information, using charts or graphs to visualize large amounts of complex data is easier than poring over spreadsheets, which in most cases can’t handle big data anyway.
Visualizations can make complex datasets clear in an instant by presenting information in real-time, intuitive, and user-friendly ways, opening up the chance to dive deeply into existing data to look for opportunities for improvement.
We previously explored how to communicate business insights effectively and create effective data stories. Today, we discuss the impact and benefits of good data visualization.
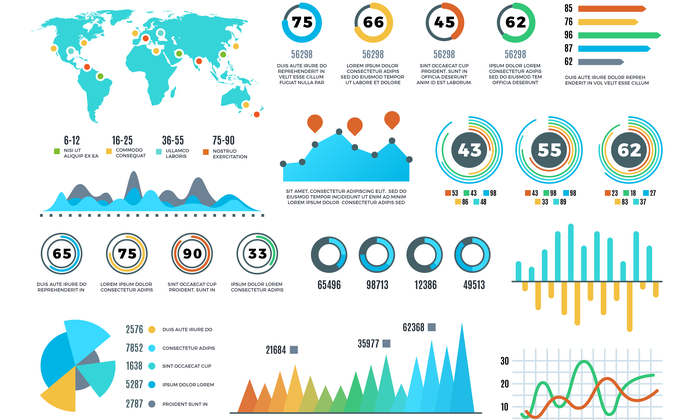
Traditionally, there are three main types of visual dashboards:
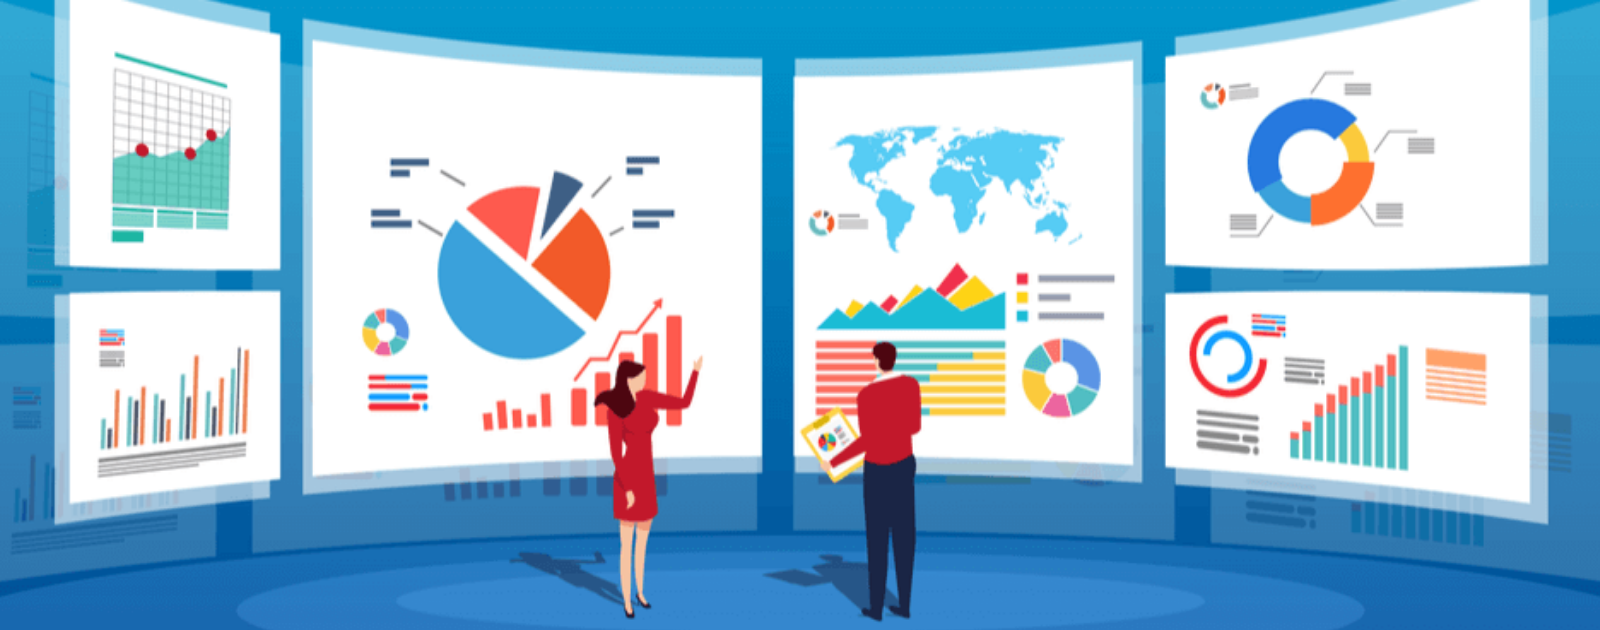
At Hoick, we modernize the approach and combine operational, strategic, and analytical into all in one dashboard, or as we call it “Holistic Insights Story”. Here is an example of a mixed dashboard showing the results of CX data.
So, let’s look at the impact on business and the benefits of data visualization.
Data will create many possibilities for observations when we visualize it. Business users are in a better position to understand and give out greater meaning to relationships between the data and business decisions. Exploring trends extracted from data allows users to concentrate on particular areas that need attention. This helps understand the relevance of those areas in order to move the organization forward with the required efforts, budgets, and objectives.
Visualizing data enables businesses to evaluate information relating to revenue, marketing campaigns, and interest in the product. It enables stakeholders to concentrate on the areas that need attention to improve profitability on the basis of the research, which in turn makes the company more profitable. Hence, with powerful and compelling visualizations, you cannot just understand the data better but also analyze it.
Visualizing the information helps find any errors in the data easily, detect incorrect data, and enable businesses to exclude it from the analysis. As previously mentioned, visuals are grasped more easily by the human brain than table records. Data visualizations inform decision-makers of new data insights. This minimizes the time spent on thinking and planning future actions, strategies, and operations.
Data visualization is a process that makes the data readily available for easy use, hopefully in real-time too. This process helps businesses in minimizing operating costs by providing detailed data and information in understandable and presentable forms at the convenience of the owners, managers, and operational employees.
The type of data you are working with and the targeted audience will both determine the best type of medium and data visualization to use. In just about any case, data visualizations make crunching big datasets more efficient, and yield bigger, better insights as a result, which leads to more improved decision making and better business performance.
How can your business use data visualization?
Connect with us for a coffee to learn more about some breakthrough business stories.
Till then, keep well and safe. 🙌