

While I am excited about the power of a well-crafted data story streamlined in a live dashboard, unfortunately, that is not the case with many businesses. From small to enterprise level, a large proportion of organizations are still struggling to uncover and understand essential insights, let alone granular, real-time, and out-of-sights.
In our world (at Hoick), we start to hate the word insights as that word has come to represent pure data puking. It comes to represent telling people, with dozens of reports (in most cases outdated) or eighty-four slides, that grass is green.
And yes, we are still stuck in the world of eighty-four slides of static information.
Some businesses are in touch (majority not) with their customers from an information perspective (insights). But too often, information just describes phenomena with no clear path of what to do with it. On the other hand, the best out-of-sight information (e.g unstructured social media data) reveals behaviors or phenomena and points to tangible solutions or ideas.
What is now structured vs unstructured data? Let’s jump into that on some other occasion.
I’ve observed, during my work with organizations across the world, that the minority is trying to uncover insights at a very high level only. For example, the revenue is 23% below the budget. Or, the average spend of resident purchasers is 4x less when compared to those who reside out of the country. Where does that leave the majority? My $0.02, the majority still operate on a gut feeling, and in an unstructured spreadsheet. Some say, we know we are in the stone age, but it works for us. I say adopt and adapt or become obsolete.
Imagine this, the revenue is 23% below the budget because our biggest competitor has launched a new product that is priced 10% less, and their customer sentiment indicates that they love it!
Yes, this is the right way forward. This way you are explaining performance (adding context)! Here are four points that you can add to your data story to drive decisions beyond the insights:
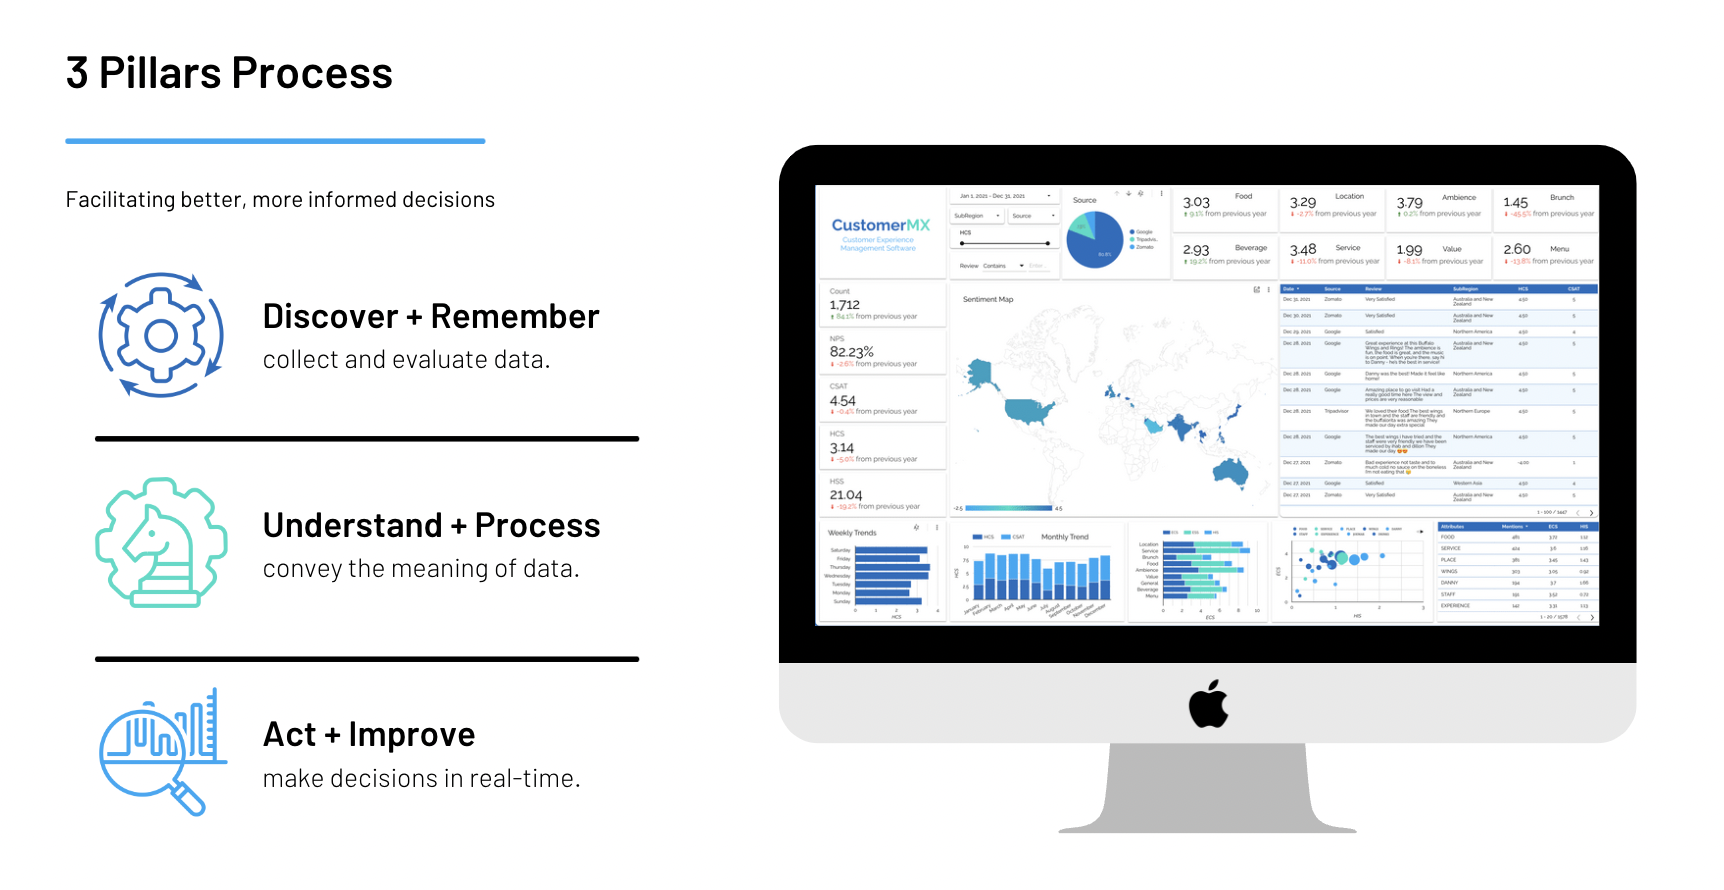
At Hoick we developed three pillars that enable us to look at out-of-sight and in-sight data. All this at a granular level, real-time, and at the touch of a button.
Einstein said, “If I were given one hour to save the planet, I would spend 59 minutes defining the problem and one minute resolving it.” Our process follows that, maybe not exactly like uncle Albert but circa, 70% of the time we take to look at the data to define problems/issues.
On average, this method saw a positive impact of 24% on the bottom line of our customers.
So what is the bottom line?
Just like how the dashboard on an airplane shows the pilot their flight path, developing a dashboard for your business does the same for your stakeholders. It helps them navigate the business path inside the data. By adding clear KPIs and highlighting important points on your dashboard and putting them in context, users will understand where the data story is headed. Then, you can work together to make sure the business gets where it needs to go with more informed decision-making.
When you check if the results of your analysis pass against all four points we touched on in this article, chances are 90% of what you do today needs to die. Because telling and reading insights that grass is green, week after week (on 84 slides ppt) results in only sadness. Don’t deliver sadness, deliver meaning and impact your business bottom-line today.